

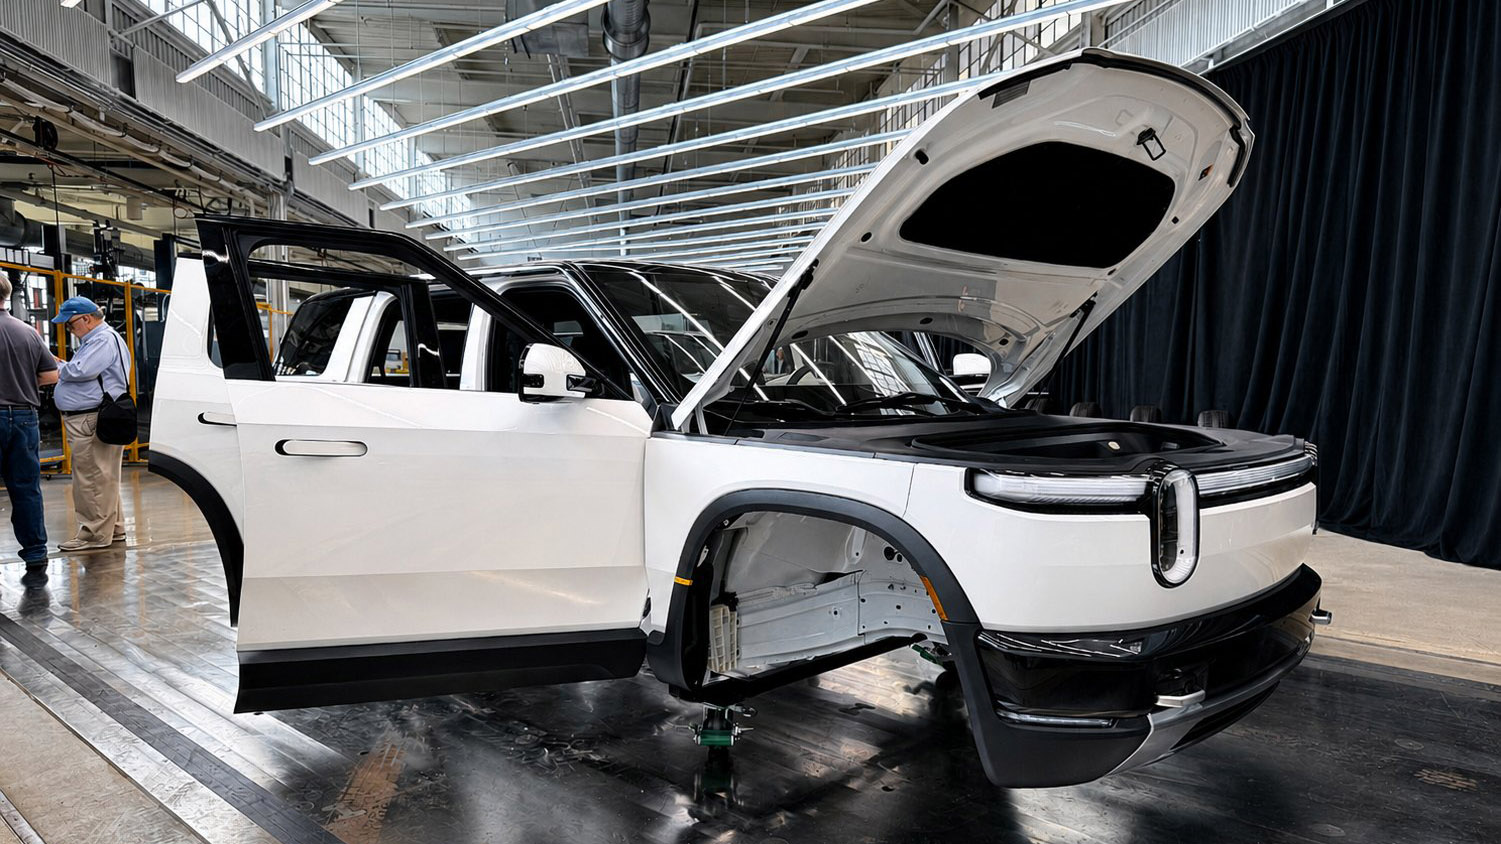

An independent side-by-side test has found Rivian‘s R2 Performance consuming between 18.4% and 26.5% more energy than the Tesla Model Y Performance at every speed measured.
The results challenge the efficiency parity the EPA ratings suggest, and that Rivian‘s own communication has promoted.
Out of Spec Reviews founder Kyle Conner and RivianTrackr founder Jose Castillo ran the two SUVs together over the weekend across five side-by-side drive cycles: 50, 60, 70 and 80 mph plus a low-speed city simulation.
The reviewers published the full consumption dataset alongside the video.
The test paired a 2027-model-year R2 Performance on its 21-inch wheels with the 2026 Model Y Performance, in a collaboration with RivianTrackr.
That R2 had been delivered to Castillo, who brought the SUV to Conner for the joint test.
The verdict was one-sided: “everyone needs to stop saying that it’s matching the efficiency of Model Y,” Conner concluded, because in his testing it did not — at any speed.
The Claim Being Tested
This parity claim is not an internet rumor.
Founder and Chief executive RJ Scaringe has stated that the R2 matches Model Y efficiency, including directly to Conner in an interview.
As reported in May, official ratings back the framing.
Both Performance models carry an identical 105 MPGe combined and 32 kWh per 100 miles, with the R2 rated at 330 miles of range to the Model Y’s 306.
On paper, the boxier, roughly 530-pound-heavier Rivian goes 24 miles farther on equivalent consumption — a remarkable outcome for a vehicle with an estimated drag coefficient near 0.28 against the Model Y’s 0.22.
As seen with the R1S and R1T, the R2 carries Rivian‘s squared-off, boxy design language rather than the teardrop profile that maximizes efficiency.
On drag coefficient, the R1S measures 0.29 and the R1T a claimed 0.30 — figures the R2 broadly inherits with its adventure-first silhouette.
How It Was Run
Both vehicles ran completely stock on their OE tires, set to the manufacturer’s cold pressure of 42 psi — identical on both vehicles — using the same gauge and compressor.
Each pack had cooled to ambient temperature before the runs began.
Climate control was fixed at 68 degrees on medium-auto in both cars, with windows closed.
The pair ran side by side on the same loops at GPS-verified speeds, alternating which car led to neutralize slipstream effects.
Both vehicles were broken in, with the Model Y showing just over 2,000 miles and the R2 just over 1,000.
The Numbers
The gap appeared at every speed and widened with pace.
At 50 mph, the R2 averaged 250 Wh per mile against the Model Y’s 206.5 — 18.4% higher consumption, the smallest gap of the day, where aerodynamics matter least.
Moving to 60 mph, the spread jumped to 26.3%, at 317 Wh/mi versus 244.3.
The 70 mph run narrowed the gap to 20.8%, at 324 versus 263.3 Wh per mile.
Conner caveated that result for heavy traffic, saying it showed “just how much benefit being in the slipstream can really help” the R2’s brick-like shape.
Then came 80 mph — the longest and cleanest run of the day at just over 30 miles, and the one Conner called the most important side-by-side result.
There the R2 consumed 406.5 Wh per mile against 318.7, a 26.5% penalty.
Finally, the city simulation delivered the surprise: 25.0% higher consumption for the R2, at 294.1 versus 235.1 Wh per mile.
That is the very environment where the EPA cycle implies the Rivian should shine, with its 114 city MPGe rating.
The Ratings VS. The Road
Conner’s explanation is procedural. “It seems like both cars were run in different tests for the EPA cycles,” he said — making the headline figures less comparable than they look.
“We are not here saying the R2 is not an efficient car,” Conner added.
Against rivals like the Hyundai Ioniq 5, in his view, the Rivian would look excellent — the comparison target here is one of the most efficient SUVs on the market.
His bottom line stayed factual rather than hostile: “Model Y is significantly more efficient. I just like accurate data out there.”
Instead, his finding is narrower and sharper: the specific claim of Model Y parity did not survive contact with the road in any of the five tests.
The Two EVs on the Sales Charts
The comparison matters because of what each vehicle represents commercially.
Start with the Model Y, the incumbent at maximum scale.
Opening last week’s earnings call, Elon Musk declared the Model Y “now the world’s best-selling vehicle, continuously setting new sales records across global markets” — with demand, in his words, surging rapidly.
Cox Automotive data backs the scale: Tesla sold 84,863 Model Ys in the US in the second quarter alone, 68.0% of the company’s domestic volume.
Meanwhile the R2 is the challenger at minimum scale: Cox figures imply roughly 789 units reached buyers in the second quarter, after customer deliveries began in June.
Assigned VINs have passed 4,100 earlier this month as production ramps toward a 20,000-to-25,000-unit target this year.
Needham has called the R2 the first legitimate competition the Model Y has faced, warning of demand headwinds for Tesla‘s best-seller — a thesis that rests partly on the R2 matching the benchmark on the numbers buyers compare.
What Still Holds
The R2 Performance features dual permanent-magnet motors producing roughly 656 horsepower and an 87.9-kWh usable pack, with prices starting from $57,990.
A consolidated next-generation heat pump is fitted to every trim, alongside 210-kW peak DC charging through a native NACS port.
Conner published the complete dataset in the video description and said corrections would be issued if any errors surface.


