The Chinese EV has been struggling this year after reaching an All-Time-High last January at $66.99. Even with many catalysts during the last weeks – NIO Day last month with a new Model (ET5), new price targets, and European Expansion – the stock price didn’t reflected the company evolution amid struggles with Chinese Government fear from investors.
Yesterday NIO was the most traded stock of the Market with 130.37 Million of shares traded – the highest Volume on a day since March 26th and one of the best days of 2021. It’s more than twice the 50.2M that change hands on a typical day.
NIO rose above 17% to $33.04 intraday before pulling back to close at $32.42, up 14.8% from Wednesday’s close at $28.25.
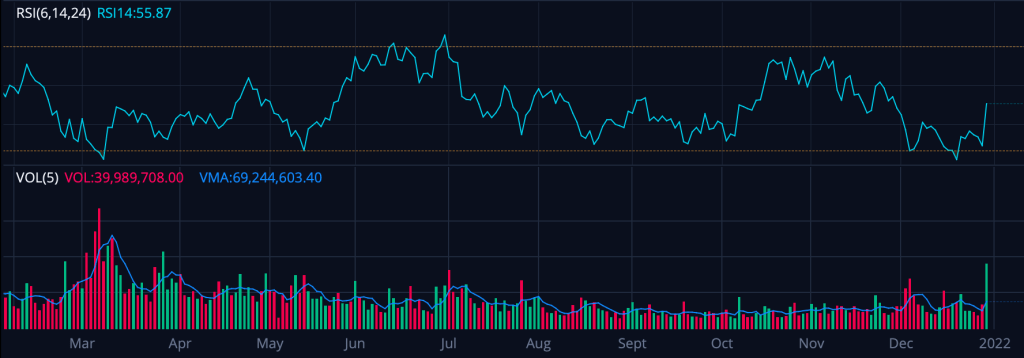
As we can see on the data below, RSI Indicator – which indicates the Oversold and Overbought levels – NIO did a double bottom on the Daily Chart and jumped yesterday from there being still far from 70.00 Level – where it is considered an Overbought Stock.
For the final confirmation, NIO needs to break the descending area around $41 after being rejected two times last June and more recently, last september. Yesterday was an important day for the stock to bring again attention from the Market and the Volume it needs for breaking this Bearish Trend from All-Time-Highs.
2022 with the Chip Shortage problems easing seems the year for EVs. Tesla opening two new GigaFactories pointing to a 2 Million Delievery Goal for next year and all the other EVs increasing their deliveries numbers month after month will definitely make 2022 a year to pay close attention to the sector.

What Is the Relative Strength Index (RSI)?
The relative strength index (RSI) is a momentum indicator used in technical analysis that measures the magnitude of recent price changes to evaluate overbought or oversold conditions in the price of a stock or other asset. The RSI is displayed as an oscillator (a line graph that moves between two extremes) and can have a reading from 0 to 100.
Traditional interpretation and usage of the RSI are that values of 70 or above indicate that a security is becoming overbought or overvalued and may be primed for a trend reversal or corrective pullback in price. An RSI reading of 30 or below indicates an oversold or undervalued condition.
Subscribe
Latest News

Onvo Delivers 10,155 in July, Its Second Straight Monthly Fall
Onvo, the family-oriented sub-brand of Nio Inc., delivered 10,155 vehicles in July, a 69.9% increase from a year earlier but a 13.5% decline from June, the group said on Saturday.

Nio’s Firefly Brand Delivers 5,771 Vehicles Globally in July, 16% of Group
Firefly, the entry-level brand of Nio Inc., delivered 5,771 vehicles in July, a 143.9% increase from a year earlier and a 16.9% fall from June, the group said on Saturday.

XPeng Delivers 38,027 Vehicles in July, Passing 1.2 Million Lifetime
XPeng delivered 38,027 vehicles in July, a 3.6% increase from the 36,717 units handed over a year earlier, the Guangzhou-based company said on Saturday.

Nio Brand Delivers 20,008 EVs in July as ES8 Retakes 10,000 a Month
The premium Nio brand delivered 20,008 vehicles in July, a 57.9% increase from a year earlier and an 8.7% decline from June, according to the brand-level split published by Nio Inc. on Saturday.

Rivian Says R2 Premium Deliveries Still Due in 2026 After CEO Cited 2027 Three Times
Rivian said the R2’s Premium trim remains on track to become available in late 2026, disputing a report of a delay — after chief executive RJ Scaringe told three different analysts on Thursday’s earnings call that the model’s additional trims would…

Polestar’s Software Chief Departs as Quality Complaints Pile Up
Polestar’s Head of Software Sven Bauer has left the Geely-backed EV maker after more than three years in the role, the executive announced on Friday.
Something went wrong. Please refresh the page and/or try again.